Thursday, April 20, 2017

SharePoint Framework Tool Chain

1. GET NODE

Download LTS ( Long Term Support ) version of node . You can also check if you have node by running
node --version

2. INSTALL NPM

NPM, also know as node package manager is used to install packages and dependencies to your project. If you are coming from a .NET background NPM is like Nugget packages in visual studio.

Usually NPM is installed as a part of Node.js installation.
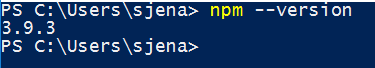
You can check the version of NPM by running the below command
npm --version

You can install npm by using the below command
npm install -g
-g is a switch which means global and it is installed globally

3. INSTALL YEOMAN

Yeoman is used for scaffolding projects. It can be installed via npm using the below command
npm install yo -g
If you have yeoman installed you can check its version using the below command
yo --version

4. INSTALL SHAREPOINT GENERATOR

This needs to be installed so that yeoman can create SharePoint projects
Use the below command to install SharePoint generator
npm install @Microsoft/generator-sharepoint -g
If you have already installed it , you can check the list of generators installed by running the PowerShell command
yo --generators

 Now your machine is ready to develop modern client webparts using SharePoint framework.

Mentioned below are a couple of new concepts we need to learn while creating these webparts

  • Typescript : is a language developed by Microsoft. This is a superset of JavaScript but is strongly typed and catches syntax errors and exceptions. This allows an easier transition for .NET developers from C# to JavaScript as you can define classes, interfaces, declare datatypes and much more.
These files have .ts as extension and are complied by tsc complier. If you are developing in Visual Studio Code, you don't need to worry about installing tsc. However you may need to if you are using some other IDE.
  • Gulp : Gulp is like MSBuild. This is used to automate tasks like build, package, debug and deploy. Gulp is also installed using  npm
npm install gulp -g
or if you have gulp already installed you can check using
gulp --version 

  • React/Angular : A learning curve to learn modern JavaScript framework like react and angular  

Monday, April 17, 2017

Delete List/Library on SharePoint Online when there is no remove or delete option

There are two possible reasons as to why you cannot see the remove or delete option on a list or a library.

  1. You don't have enough permissions.
  2. The library or list was created with "Allow Deleting" property set to false.
In this post I am going to talk more about Point #2 and discuss how can we set it to true using CSOM for SharePoint Online.
I am creating a console application using visual studio and using the latest version of SharePoint online CSOM.  The older version of this nugget package does not contain enabling "Allow Deletion: . So make sure you get the latest version.

Add the nugget package in below picture.


string siteCollectionUrl = "https://company.sharepoint.com/";
            string userName = "user@microsoft.com";
            string password = "xxxxxxxx";

            
            ClientContext ctx = new ClientContext(siteCollectionUrl);

            
            SecureString secureString = new SecureString();
            password.ToList().ForEach(secureString.AppendChar);

            
            ctx.Credentials = new SharePointOnlineCredentials(userName, secureString);

           
            Web web = ctx.Web;

            ctx.Load(web);
            ctx.ExecuteQuery();

            Console.WriteLine(web.Url.ToString());  

            Console.WriteLine("Current Site: " + web.Title);

            List library = web.Lists.GetByTitle("Documents");
            ctx.Load(library, l=>l.AllowDeletion);
             ctx.ExecuteQuery();

            Console.WriteLine("Allow deletion for library is : " + library.AllowDeletion);


Since "Allow deletion" property is set to false. We have to set it to true to get back the delete list/library link.


if (!library.AllowDeletion)
            {
                library.AllowDeletion = true;
                library.Update();
                ctx.ExecuteQuery();

                ctx.Load(library, l => l.AllowDeletion);
                ctx.ExecuteQuery();
                Console.ForegroundColor = ConsoleColor.Yellow;
                Console.WriteLine("Allow deletion for library after update is : " + library.AllowDeletion);
            }


Now if we go back to the library and refresh the settings page of list/library. We now see that the delete link is back.


Thursday, April 14, 2016

Create Graphs and Charts from SharePoint lists using charts.js

Chart.js is an HTML5 responsive library to build beautiful charts.

Now that charts web part is no longer available in SharePoint 2013, I decide to go for this option. We can also use excel services , but I like this better :)


We will be using REST api to pull items from the list and draw out charts
Create a canvas tag
<canvas id="myChart" width="600" height="400"></canvas>
Include  jquery.js , chart.js and underscore.js  and the below script will do the work.

Make sure to change the List name and use internal name for columns instead of display name. Add this to the script editor or content editor web parts . If you are on one site and want to get data from another site you have to modify the code.

var chartX = []; //X-Axis Labels
var chartY = []; //Y-Axis Values

var chartJs = "https://cdnjs.cloudflare.com/ajax/libs/Chart.js/1.0.2/Chart.js";

var chartId = "myChart"; //Chart Canvas Div    
var charts = ["Line", "Bar", "Radar", "Polar Area", "Pie", "Doughnut"];
var colors = ["#009EA0", "#A7A9AC", "#D15F27", "#BAD80A", "#E0AA0F", "#754760", "#373535"]

var listName = "Incoming Requests"; //Data List Name
var xAxisName = "Request_x0020_Category"; //X-Axis Label Names from List
var yAxisName = "Time_x0020_Calc"; //Y-Axis Values from List

//Set chart number to render different charts
// 0 = Line Chart
// 1 = Bar Chart
// 2 = Radar Chart 
// 3 = Polar Area Chart
// 4 = Pie Chart
// 5 = Doughnut Chart    
var chartNumber = 3;
//Set group by boolean to create chart based on count of x Axis 
var boolGroupByXAxis = true;
var numberOfItemsFromList = null; //Limit number of items returned from the list , for unlimited items type null 

$(document).ready(function() {

    console.log(_spPageContextInfo.webAbsoluteUrl);
    var Url = _spPageContextInfo.webAbsoluteUrl + "/_api/web/lists/GetByTitle('" + listName + "')/items"; //
    if (numberOfItemsFromList != null) {
        Url = Url + "?$top=" + numberOfItemsFromList;
    }
    getItems(Url, boolGroupByXAxis, charts[chartNumber]);


});

function getItems(url, groupby, chartType) {
    $.ajax({
        url: url,
        method: 'GET',
        beforeSend: function(XMLHttpRequest) {

            XMLHttpRequest.setRequestHeader("Accept", "application/json; odata=verbose");
        },

        cache: true,
        error: function(data) {},

        success: function(data) {
            if (!groupby) {
                $.each(data.d.results, function(i, item) {
                    chartX.push(item[xAxisName]);
                    chartY.push(item[yAxisName]);
                });
            } else {
                var arrCount = _.countBy(data.d.results, function(obj) {
                    return obj[xAxisName];
                });
                console.log(arrCount);
                chartX = _.keys(arrCount);
                chartY = _.values(arrCount);
            }
            loadJS(chartJs, function() {

                //Generate Data
                var data = [];
                if (chartType == "Line" || chartType == "Bar" || chartType == "Radar") {
                    data = {
                        labels: this.chartX,
                        datasets: [{
                            fillColor: "rgba(0,160,175,0.5)",
                            strokeColor: "rgba(0,160,175,0.8)",
                            highlightFill: "rgba(0,160,175,0.75)",
                            highlightStroke: "rgba(0,160,175,1)",
                            data: this.chartY
                        }]
                    };
                } else if (chartType == "Pie" || chartType == "Doughnut" || chartType == "Polar Area") {
                    $.each(chartX, function(i, item) {
                        data.push({
                            value: chartY[i],
                            color: colors[i],
                            label: item
                        });
                    });
                    console.log(data);

                }

                //Display Chart
                var ctx = document.getElementById(chartId).getContext("2d");
                switch (chartType) {
                    case "Line":
                        var myNewChart = new Chart(ctx).Line(data);
                        break;
                    case "Bar":
                        var myNewChart = new Chart(ctx).Bar(data);
                        break;
                    case "Radar":
                        var myNewChart = new Chart(ctx).Radar(data);
                        break;
                    case "Polar Area":
                        var myNewChart = new Chart(ctx).PolarArea(data);
                        break;
                    case "Pie":
                        var myNewChart = new Chart(ctx).Pie(data);
                        break;
                    case "Doughnut":
                        var myNewChart = new Chart(ctx).Doughnut(data);
                        break;
                    default:
                        var myNewChart = new Chart(ctx).Line(data)
                }

            });
        }
    });
}


function loadJS(src, callback) {
    var s = document.createElement('script');
    s.src = src;
    s.async = true;
    s.onreadystatechange = s.onload = function() {
        var state = s.readyState;
        if (!callback.done && (!state || /loaded|complete/.test(state))) {
            callback.done = true;
            callback();
        }
    };